

End-to-end marketing analytics: Minimal Modeling case study

[This is a guest post, written by Olga Tatarinova from Epoch8.co. Epoch8 are the early adopters of Minimal Modeling, and they have been getting some very interesting results. I’m really happy to have this post on the substack. —A.M.]
As an analytics/ML agency, we offer analytical solutions for our customers and recently became huge fans of the Minimal Modeling approach. This happened for several reasons:
Documentation. Minimal Modeling is documentation-first, so if we follow the modeling guidelines, the datasets we get are fully documented from the ground up.
Speed. Minimal Modeling treats each Anchor, Attribute, and Link independently, so we can split the implementation scope between analysts to speed up the work.
Knowledge transfer. Projects that use Minimal Modeling concepts are easy to maintain and explain to new team members and to the customers.
In this post, we want to share our approach to building end-to-end marketing analytics using Minimal Modeling.
Task
End-to-end marketing analytics is used to evaluate the effectiveness of advertising channels in terms of driven income. Here are some details:
There are several advertising channels: Facebook, Instagram, Google Ads, SEO, and so on.
Advertising campaigns from those channels attract website visitors.
Google Analytics logs visits, together with utm_source, utm_medium, utm_campaign attributes, and information about user purchases.
The goal is to estimate the impact of each advertising channel and campaign on user acquisition and revenue.
We have raw data from all the datasources ingested in BigQuery, so we can focus on data modeling.
Logical modeling
Identifying Anchors
First, we identify Anchors. We try to follow our customers’ language in describing the domain, so we capture the nouns they use. We noticed that these nouns make perfect Anchors.
In our case we have:
⚓ User (fetched from Google Analytics, identified by google client id);
⚓ Campaign (also fetched from Google Analytics, identified by utm_source, utm_medium, utm_campaign);
⚓ Visit (the fact of the user visiting the website, fetched from Google Analytics);
⚓ Transaction (the fact of purchase, fetched from the website backend).
Also, there are some more Anchors that we’ve identified from the dataset:
⚓ Facebook Campaign
⚓ Facebook Ad
⚓ Google AdWords Campaign
⚓ Google AdWords Ad
etc, same for each advertising channel.
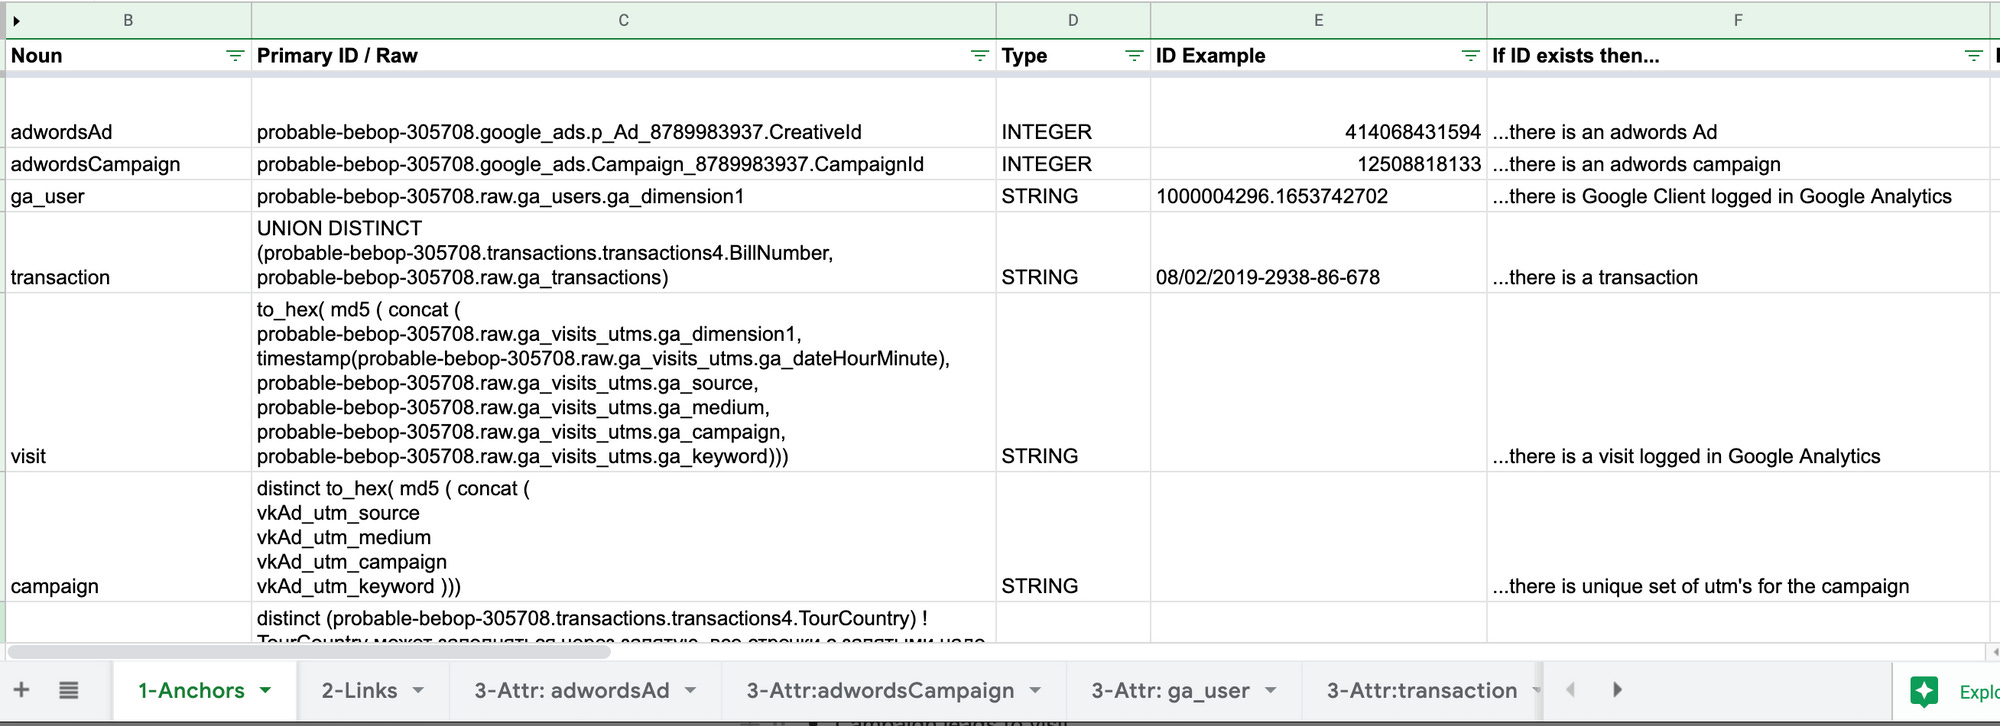
We document all Anchors in the spreadsheet.
Identifying Links
The next step is to identify links. Links contain the information about the business logic and show what's going on in the system.
We found that having a graphical representation of anchors and links between them facilitates collaboration between business analysts and the customer. So we came up with a data modeling process when we have a zoom call with the customer, collaboratively draw anchors and the links between them, and discuss business logic details.
So, our main links are:
⚓ User is attracted by the ⚓ Campaign
⚓ Campaign attributes the ⚓ Visit
⚓ Campaign gets its costs from ⚓ Ads
⚓ Visit leads to ⚓ Transaction
⚓ Transaction attributes value to some prior ⚓ Visit, according to the attribution model

All the links and their attributes are also documented in the spreadsheet:

Attributes
We identify and describe all the attributes, but we find it useful to show only the main ones on the graphical scheme so the core aspects of the business logic stay visible.
If the definition of main attributes or the business logic behind them changes, this might cause dramatic changes in the whole data model.
In our case the most important attributes are:
the attributes of the ⚓ Campaign
utm_source
utm_medium
utm_campaign
the attribute of the ⚓ Transaction
transaction revenue
the attributes of the ⚓ Visit
visit number
visit cost
visit value
the attribute of the link “Transaction returns value to the Visit”
attribution coefficient (which shows how much value does the Transaction attributes to the Visit).

At this point all business logic is clear and we can proceed to the physical implementation.
Physical implementation
We represent each anchor, attribute and link as a separate database table.
We create:
a separate table for each anchor, containing anchor id (yes, just the single column!);
A separate table for each attribute, containing anchor id and the attribute name (two columns);
A separate table for each link, containing ids of both linked anchors (again, two columns).
We try to keep the tables narrow, but in most cases we have some extra columns:
Timestamp: for anchors and attributes usually it’s their creation time, for links — it’s the timestamp, when the link was created
Partitioning key: as we use BigQuery, we need to partition the tables for more cost-efficient queries
Data source name: sometimes we have to keep track of the data source of the anchor or attribute. For example we get some data from Excel files and need to track the name of the source file.
We use DBT for data transformation and as a side-effect of having all attributes implemented separately we get clear data lineage.
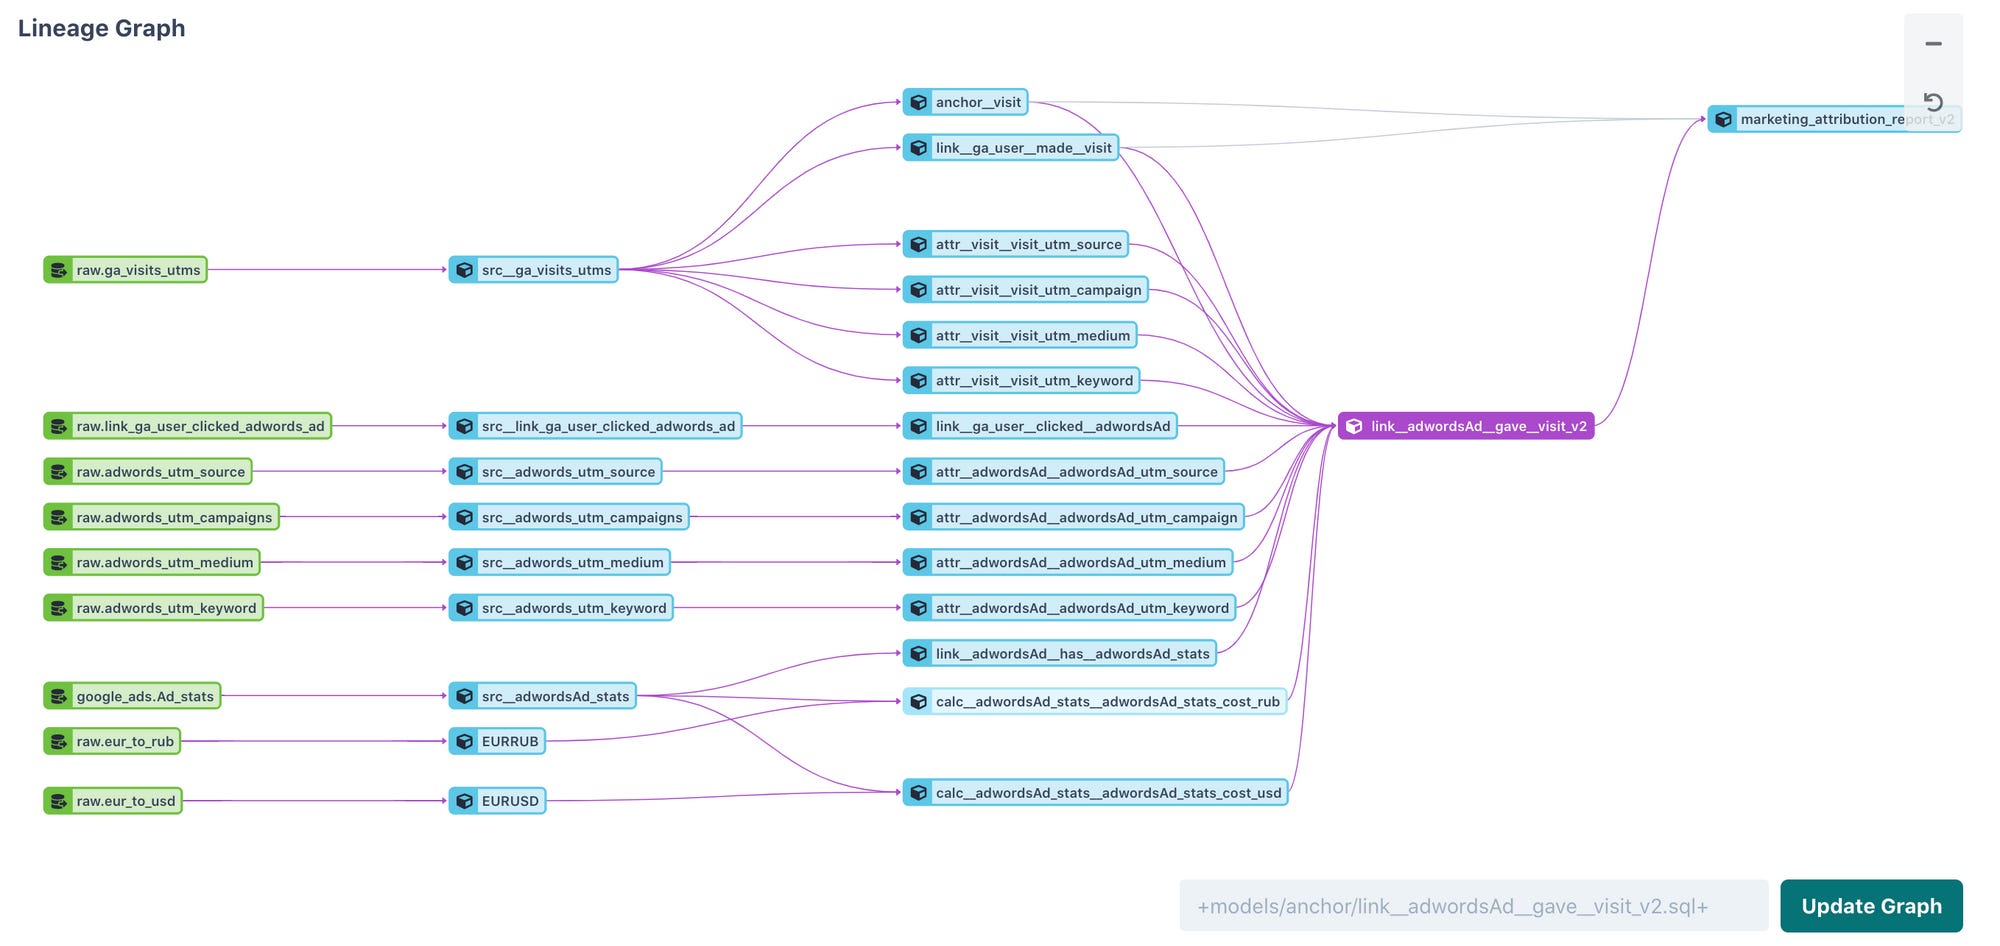
Data lineage for the link “AdWords Ad led to the Visit”. We can clearly see which attributes are used in the calculations.
Another side-effect of keeping all the anchors, attributes and links in the separate tables is the ability to split the implementation work between analysts.
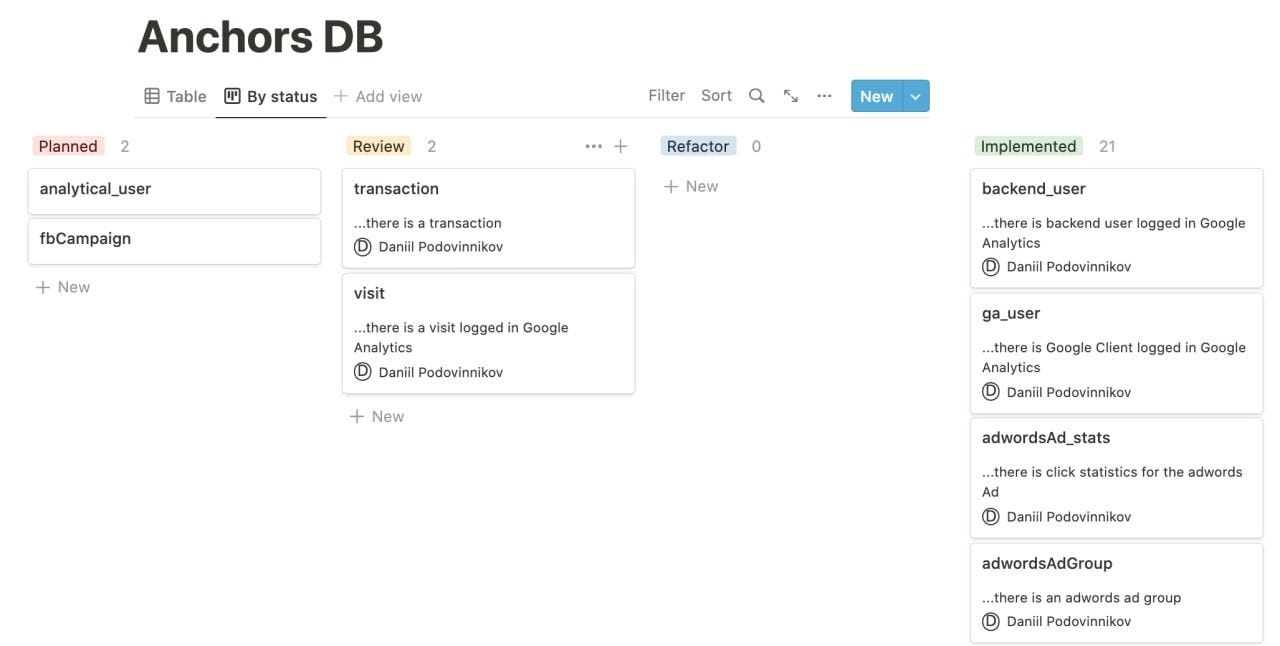
The list of anchors in Notion, turned into the task-list. As we all know, everything can eventually become a task-list.
The resulting tables for anchors, attributes and links implement documented data API on top of the raw data which is used by many data customers.
Preparing data for the customers
We have several customers for our data API:
ML team. They fetch data from per-attribute tables “as is” and use it for the machine learning tasks;
Data visualization team. We provide analytical reports in PowerBI, so we still have to also create wide tables and pre-aggregated tables for reporting. We build these tables by LEFT JOIN’ing attributes tables with the anchor table. We don’t calculate any attributes in the wide tables, they are used for analytical purposes only.
Self-service analytics tool. We use Metabase for self-service analytics purposes and have a separate set of wide tables for Metabase. For analytical purposes link tables can be treated in a way resembling fact tables in Kimball modeling.
What is good about having the separate table for each attribute is that we have the single source of truth. So, if the attribute is used in multiple final wide tables and the definition of this attribute changes, we have to change only the attribute table. All other dependent tables are recalculated automatically. This helps to maintain data consistency across all the final destinations.
Conclusion
As a result of the project we implemented end-to-end marketing analytics using Minimal Modeling concepts.
Following Minimal Modeling guidelines allowed us to get some important consequences:
the dataset is fully documented "by design" and keeping the documentation updated and consistent is the integral part of the process;
all the anchors, attributes and links are implemented independently, so it’s easy to add new data to the model;
analysts, who join the project on the later stages, can easily understand the logic of data transformations, quickly get up to speed and begin contributing.
You can contact Epoch8 at https://epoch8.co/
 | A guest post by
|