Documenting your data: WordPress case study, pt. 1
240 tables and no documentation: making sense of your database

A very common question I see on database-related forums goes something like:
“At my new place of work, there is a database with hundreds of tables, barely any documentation, and I need to understand it to do my job: running SQL queries.
[additional complications are usually described]
Any advice on how should I approach this problem?”
You could answer that question on different levels, but I’d like to discuss an approach that is focused on the immediate situation that this person is in. How to organize the company’s data management processes is a bit above our pay grade here.
A problem
Suppose that you’ve recently joined a new company as a data engineer, business analyst, or some such. Basically your job is to create reports of all sorts, building queries, pipelines etc. A very common situation is that there are a lot of tables (say, a few hundreds), and a very limited amount of documentation. Sometimes you have access to people who’ve worked at the company for quite some time, but they are not readily available for advice. Usually there are also several different databases: say, an OLTP database in Postgres, MySQL or Oracle, and a copy of that in some sort of data warehouse, sometimes in many different versions.
How do you start learning what is what in the database? What sort of data is there, how is it stored, how reliable is the data, how clean, etc., etc?
A knee-jerk approach is to document the tables and their columns. This is what’s often considered the data catalog. Unfortunately, if you try this you’ll find that this approach does not work. In a follow-up article we’ll discuss why, but let’s focus on an approach that may have a better chance of working for you.
Case study: WordPress
Let’s use a real-world database as an example: a WordPress database schema. The official description could be found on https://codex.wordpress.org/Database_Description. This page has everything that is traditionally used to document databases:
a physical ERD diagram;
an overview of tables;
a detailed table structure (in a tabular format);
We could also consult a more compact database schema expressed as a sequence of SQL CREATE TABLE statements: https://gist.github.com/squadette/3bafa201a04f1372d69c182f206f8975.
We’re going to use a different approach based on Minimal Modeling (https://minimalmodeling.com/).
We’ll be documenting the database using a four-part catalog in a tabular format:
list of anchors;
list of attributes;
list of links;
list of secondary data.
We’ll work incrementally. In the first part we’ll show how to document just a few of each data element: anchors, attributes and links, just enough to illustrate the approach. In the follow-up posts, we’ll build the complete database documentation.
It’s not necessary to build the full design upfront. This helps you deal with large databases: you need to document only the parts that you are directly interested in. The entire data catalog is structured in such a way that you can easily document additional data elements.
Anchors first
We start with anchors (also known as entities). Anchors are nouns, but not every noun is an anchor. To find anchors, we need to look for things that could be added and counted.
Let’s look at the list of tables:
mysql> show tables;
+-----------------------+
| Tables_in_wordpress   |
+-----------------------+
| wp_commentmeta        |
| wp_comments           |
| wp_links              |
| wp_options            |
| wp_postmeta           |
| wp_posts              |
| wp_term_relationships |
| wp_term_taxonomy      |
| wp_termmeta           |
| wp_terms              |
| wp_usermeta           |
| wp_users              |
+-----------------------+
12 rows in set (0.00 sec)
The most common anchor is probably User (we found it in the wp_users table). It’s easy to confirm that users could indeed be added and counted:
We have 100 users in our database.
One more user has just registered.
Such sentences sound trivial in simple cases, but would become useful in more complicated cases. Hopefully, later we’ll find an example of such in WordPress.
WordPress is a content management system, and the most common type of content is Post and Comment. Both posts and comments could be added and counted. Let’s add those three into the first part of our Minimal Modeling catalog:
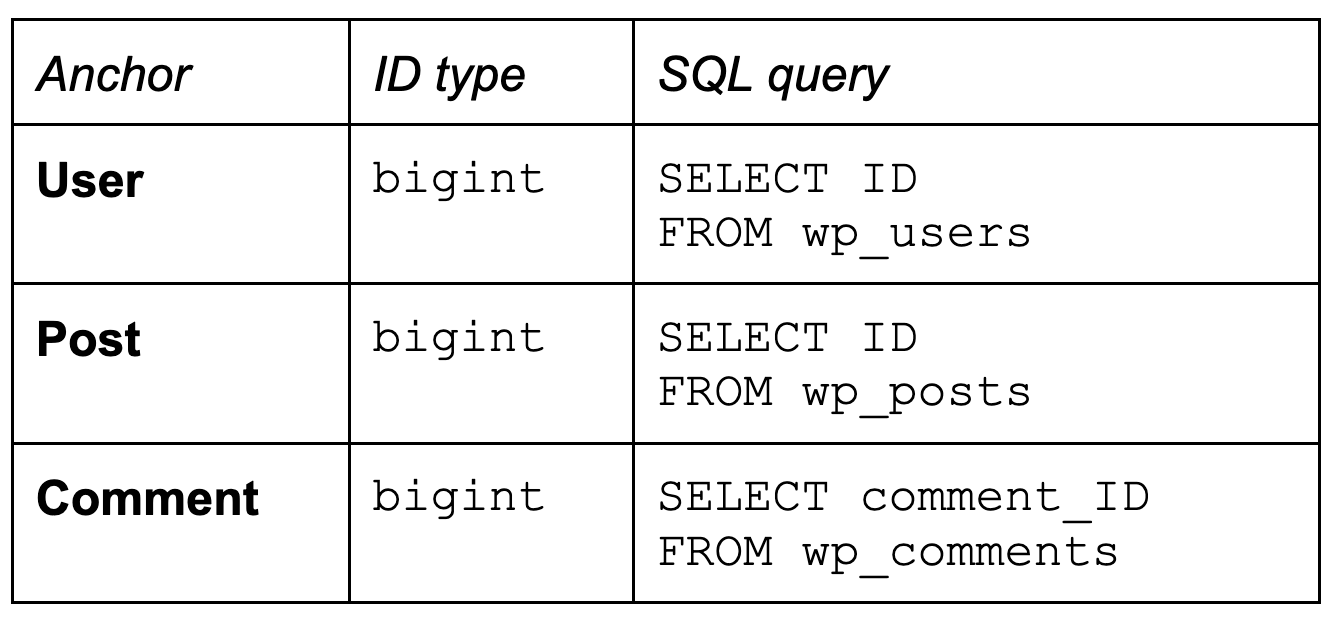
The first column is an anchor name; you choose anchor names according to the business vocabulary. They do not necessarily match table names (table names are often unclear or misleading).
The second column documents ID type; in this case it’s “bigint”, an SQL data type. If you have more interesting IDs you could also provide examples of IDs so that you could better recognize them in data. In most cases, of course, the IDs are pretty opaque: just some integers or UUIDs.
The third table contains an SQL query fragment that returns all the IDs of the corresponding anchor, and nothing else. So if we have ten users, the query would return ten different IDs of those users.
Here we begin to see some interesting details, for example the fact that Comment uses a different naming convention for the ID column than the other two.
Three anchors is enough for the start, now let’s look at some attributes.
Attributes
Let’s document a couple of attributes for each anchor. Attributes contain the actual data: strings, numbers, yes/no values, and so on. Note that attributes cannot contain anchor IDs (this is handled by links, see below).
Let’s look at the definitions of wp_users, wp_posts and wp_comments, and find some simple attributes. If we look at the real data in a test WordPress installation, it’s easy to see which data goes where.
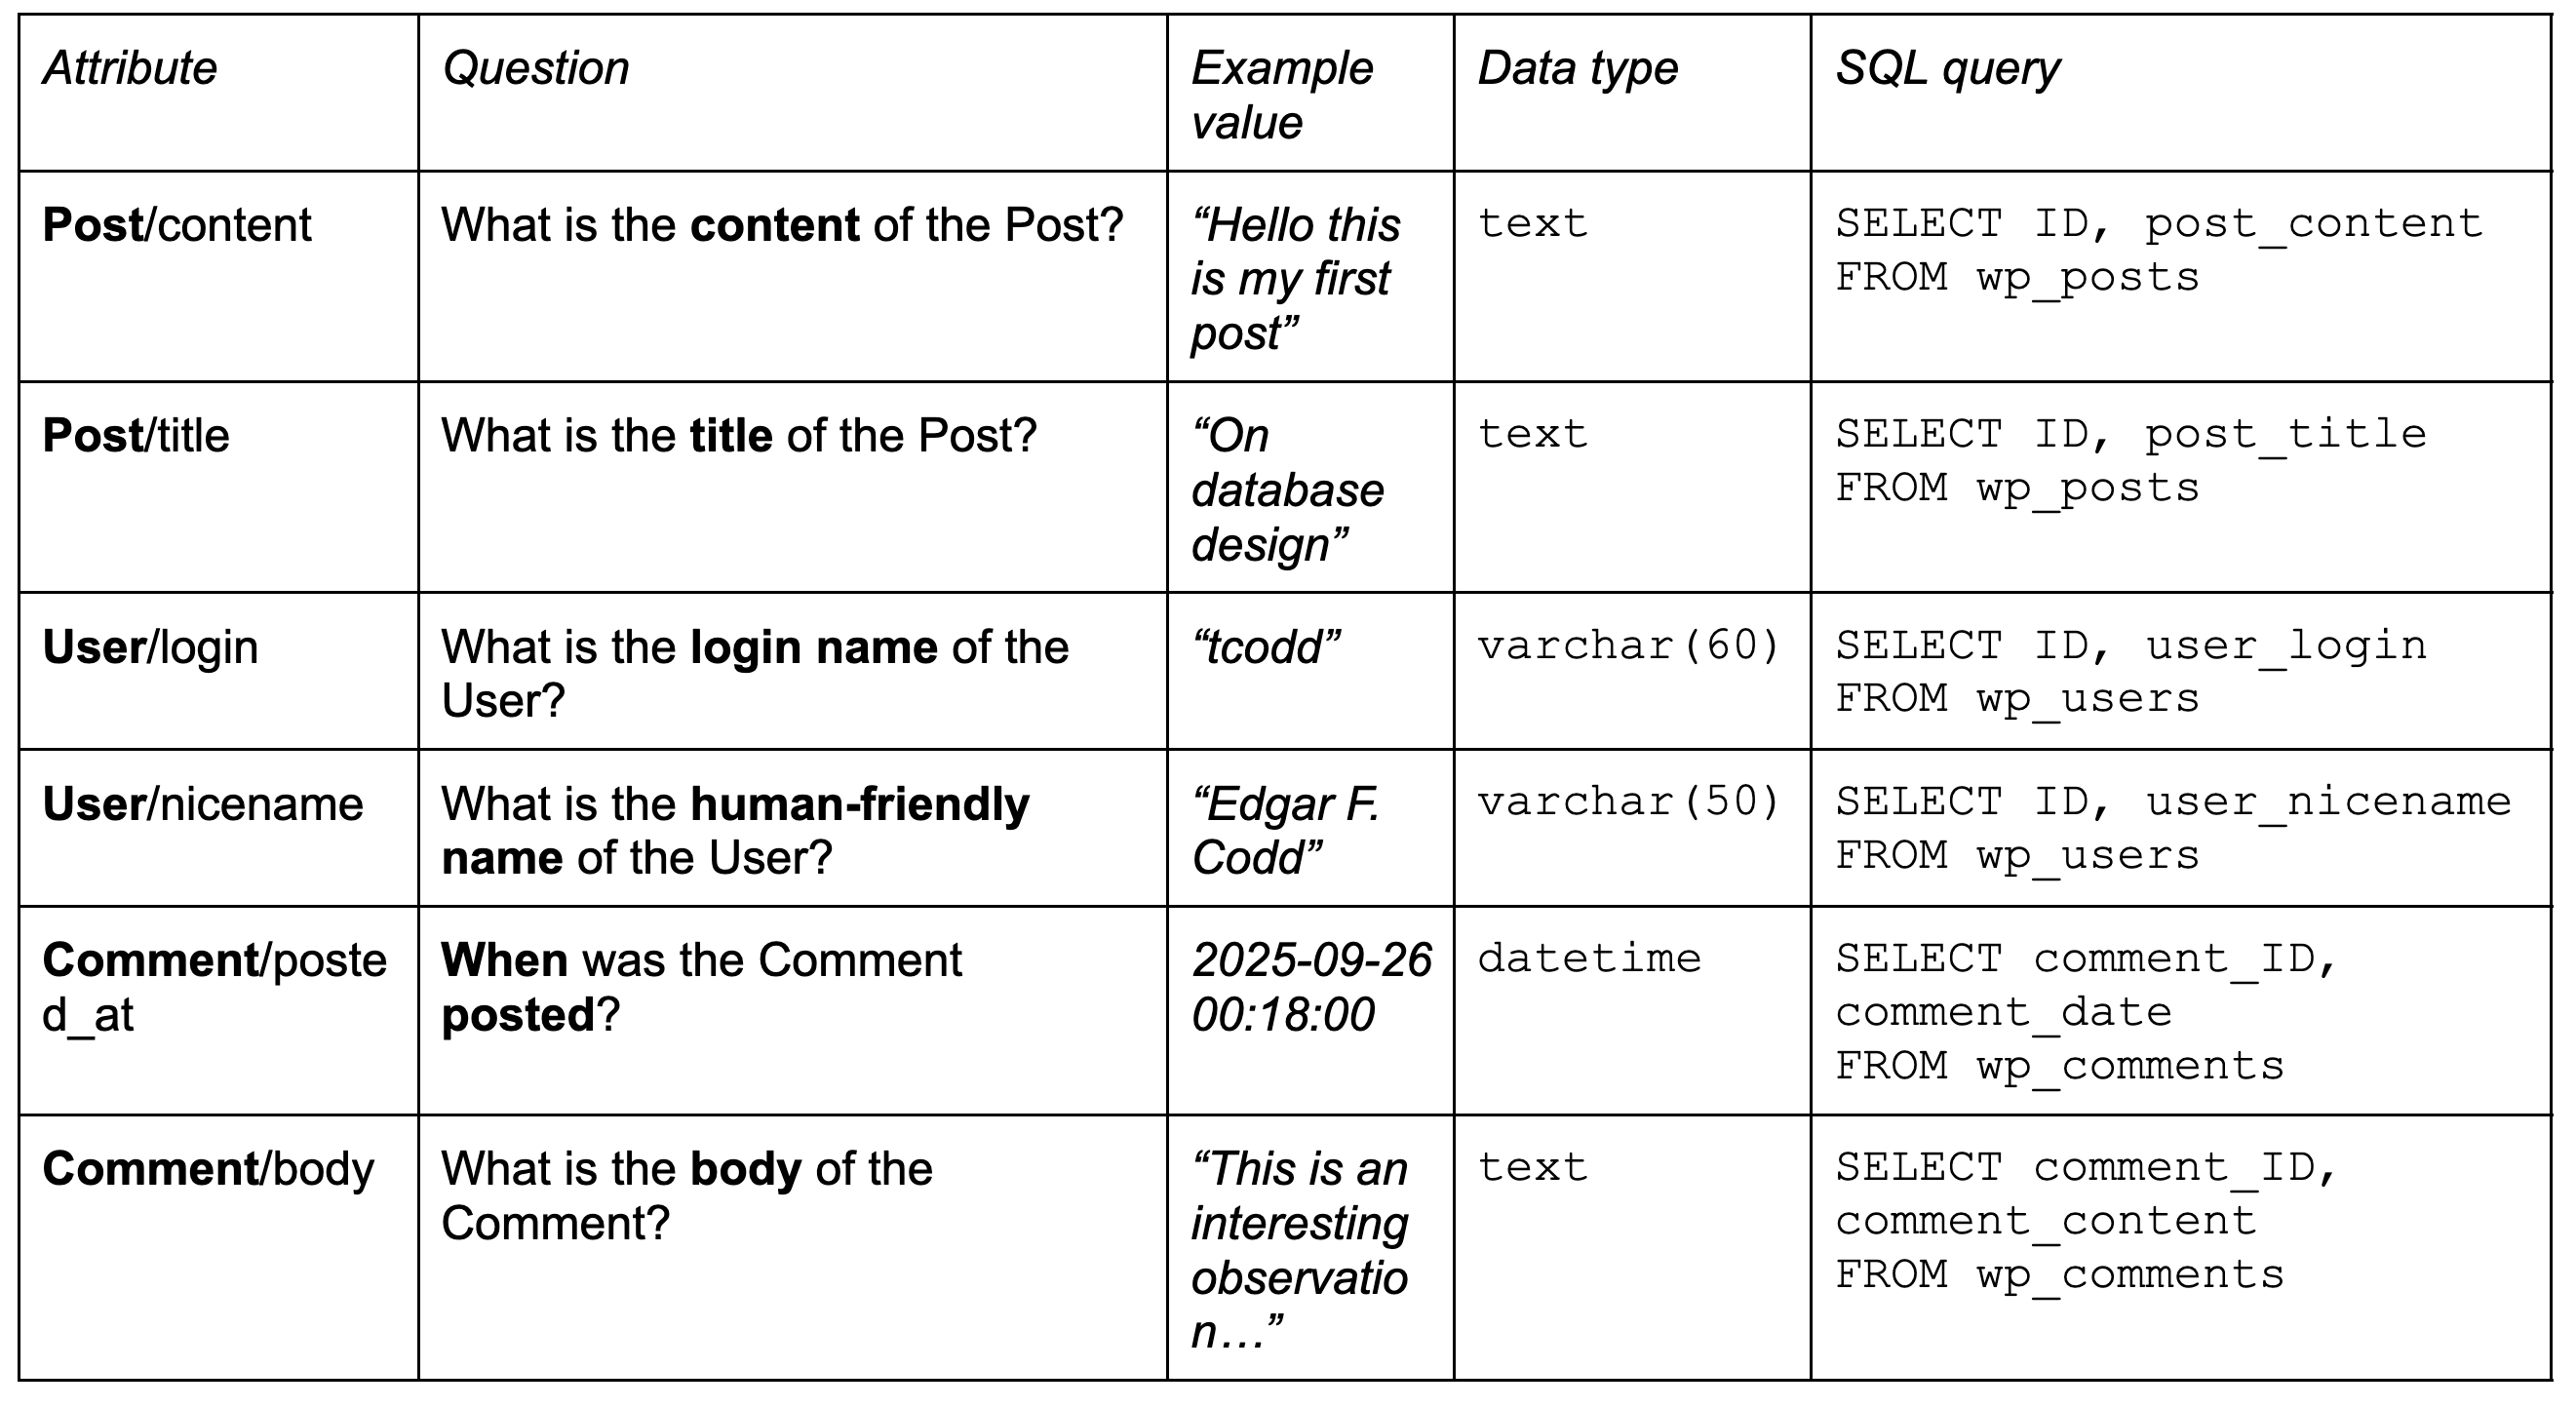
The first column is the attribute name. It combines the name of the anchor and some short readable name of the attribute. You can use this string to refer to the specific attribute in other documentation, or just during the discussion.
Note that the attribute name is only remotely related to the column name where the attribute is stored.
The second column of our table contains the most important piece of documentation: a question. We use questions for every attribute. In casual speech people would often just say something like “Name of the User”, or “Item price”, but we take one step further and provide longer and more unambiguous description. Questions help you to document the semantics of less trivial attributes. Additionally, it helps LLMs to understand what exactly is stored here.
The third column is an example value. Practice shows that even a single representative sample of data immediately help with understanding a piece of data. That’s how you can see, for example, that the login name of the User is clearly machine-readable, or that Comment/posted_at has the granularity of one second.
Column #4 is the physical data type. Here we just use normal SQL data types, as defined in your schema.
Finally, SQL query. It needs to return a dataset with exactly two columns: anchor ID and the attribute value. The queries presented here are simple, but you can also extend them to show how to clean the data. We’ll discuss data quality later.
Links
Links roughly correspond to relationships. Links connect two anchors using a verb. Let’s write down all the links that we have between our three anchors so far:
User publishes a Post;
User posts a Comment;
Post has Comments;
How did we find those links? Because we, as users, understand how WordPress works. To make sense of the database, you should have some understanding of the business. As you explore the database schema and present it as the Minimal Modeling catalog, you’ll get more detailed understanding.
Each link has an associated SQL query. This query must return exactly two columns: an ID of the first anchor and an ID of the second anchor.
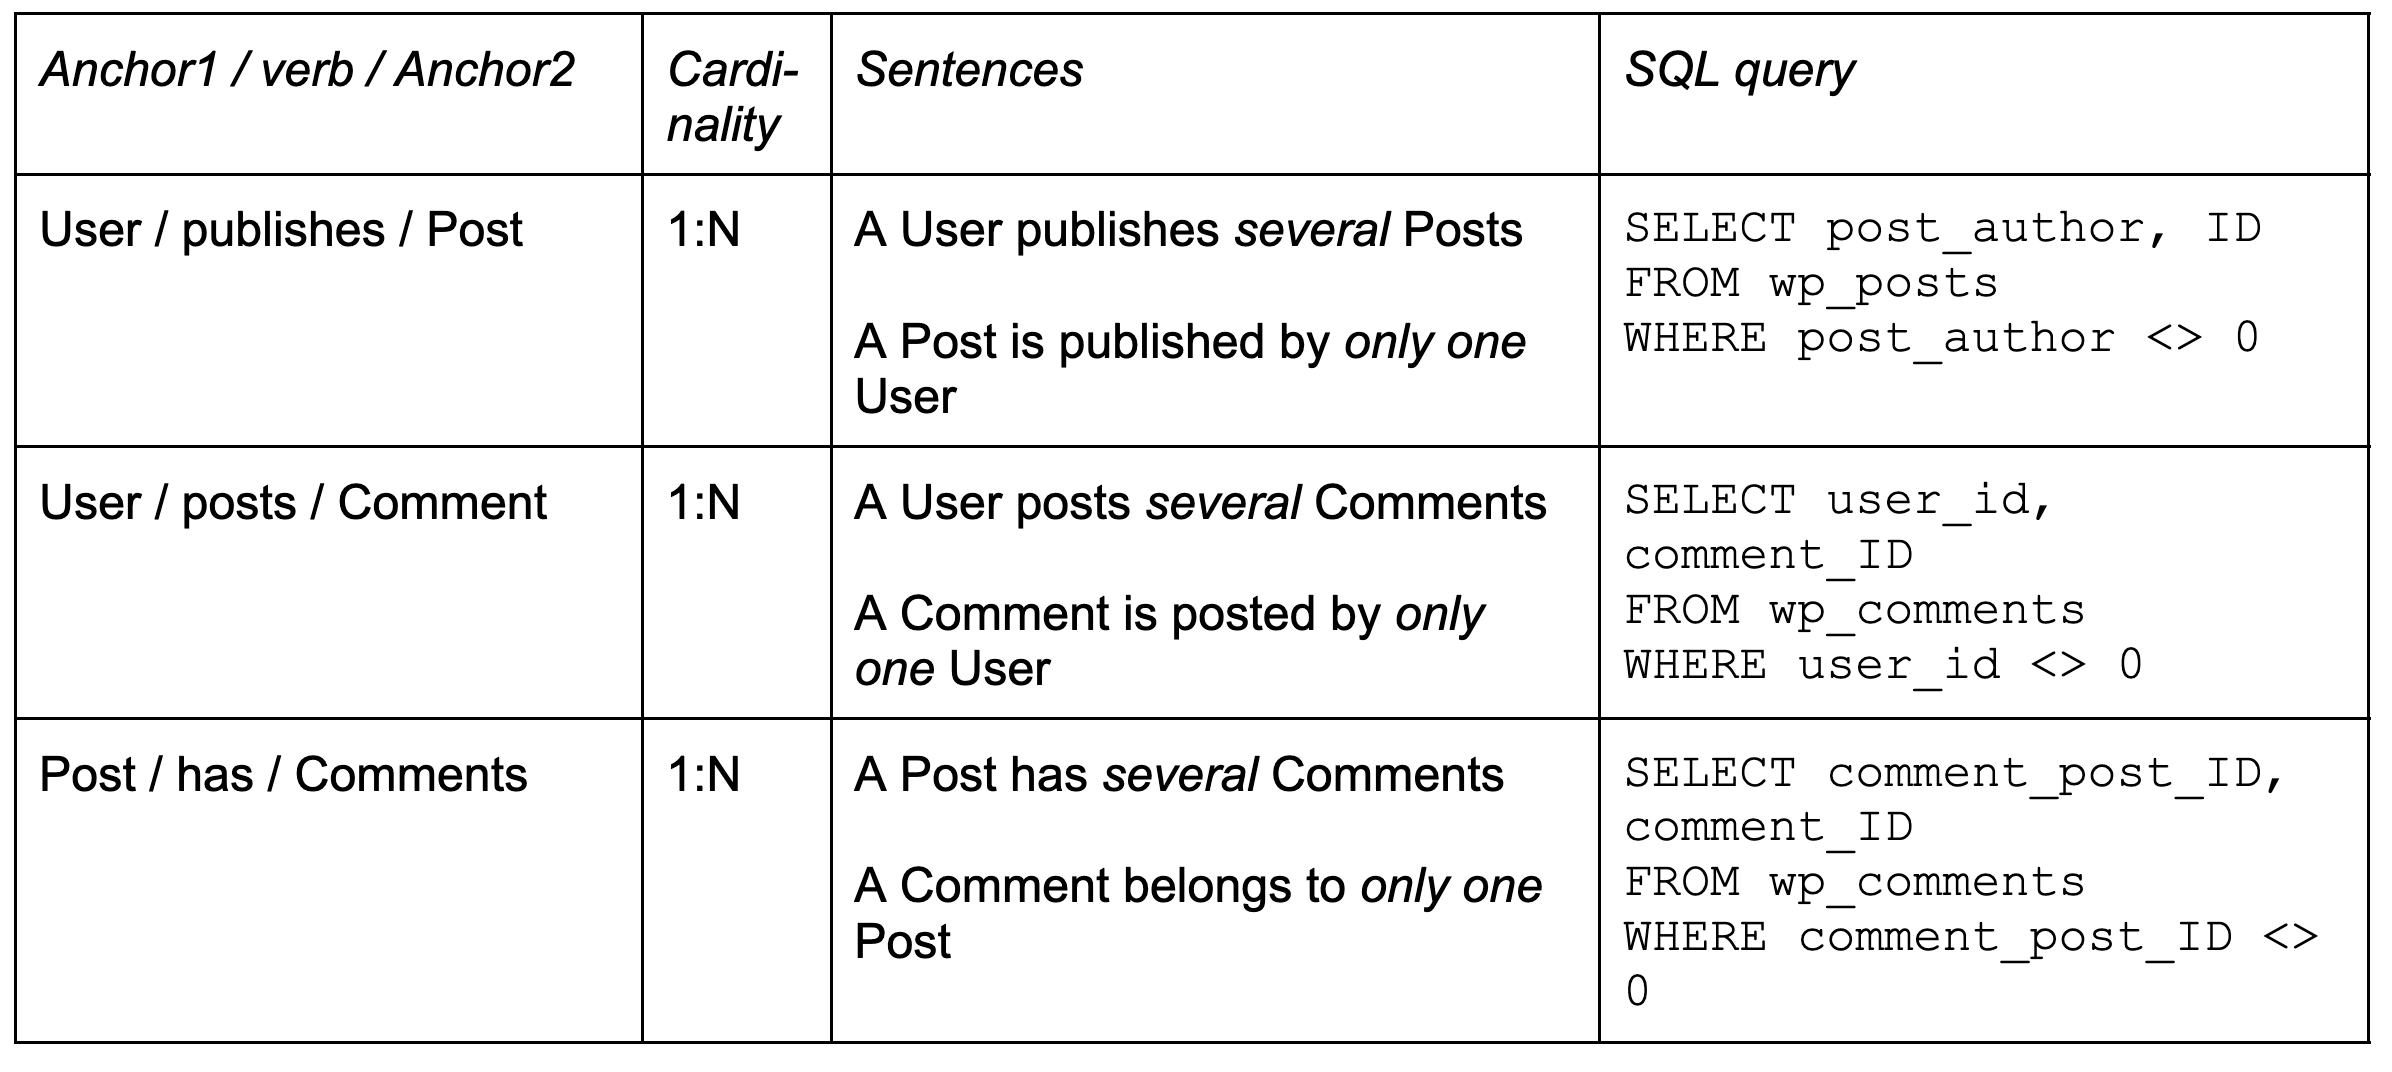
Let’s discuss each of the columns in that table. The first column contains names of both anchors and the main verb that connects them. Both anchors must be present in the list of anchors that we have.
In our example the anchors are different, but they could also be the same: for example, “An Employee is a manager of another Employee”.
The second column shows link cardinality. In Minimal Modeling, we use only three options:
1:N;
M:N;
1:1.
In column #3 we describe the link in a more verbose, slightly formalized way. We write down TWO sentences, one in each direction. We use the words “only one” and “several”: this helps us to confirm the cardinality of the link (we avoid using word “many”).
For example, “several Posts” means that the Post anchor is on the N-side of cardinality, “only one User” means that User is on the 1-side.
Here all three links are 1:N, but we hope to try and find some M:N and 1:1 links later in our investigation.
Finally, we have a column that contains an SQL query for each link. Note that this query must return clean data: two valid IDs, no NULLs or anything like that.
Taking the first link, “User / publishes / Post”, as an example, here is how its table is defined:
CREATE TABLE `wp_posts` (
    `ID` bigint(20) unsigned NOT NULL AUTO_INCREMENT,
    `post_author` bigint(20) unsigned NOT NULL DEFAULT ‘0’,
    . . . .
);
See that the “post_author” column is defined as NOT NULL, but then it immediately allows using a value of 0 to, apparently, mean that the post has no author. We must make sure that only valid IDs are returned, so we filter out NULLs and other sentinel values (e.g., “WHERE post_author <> 0”).
That’s enough data elements for the first part. We’ll continue assembling the data catalog in the following article.
Tooling
To use this approach, you need to maintain four tables. Here we show anchors, attributes, and links, but there is also secondary data, more on that later.
There is no “official” tooling at the moment, but you can use any spreadsheet-like tool that is convenient. Most probably you want to use a collaborative tool, but in some cases even having private notes about the database is what you need.
You can use Google Docs, like I do as I write this document. You can use Notion, Roam, or Obsidian. You can use any Wiki that has good support for tabular data, or even Markdown.
Early adopters of Minimal Modeling use Grist, and I guess that Airtable or something similar would also work great. You can use Google Sheets too, or Excel.
Process
The idea is that you never try to do big modeling upfront. Instead you start just with a handful of data elements in a shared document, and add new entries as needed.
For example, as you work on some query, you learn about some new tables and columns that are not yet documented. So you document them: do they contain a new anchor? A new attribute? A new link?
Note that sometimes a single database table column can store many different attributes. The most common example here is EAV (Entity-Attribute-Value approach).
Note that the catalog tables could be extended with the extra information that you’re interested in. For example, in many companies it makes sense to keep track which of the attributes contain personally-identifiable information (PII), or other regulated data, such as financial information. You can just add another column in the “attributes” table, and enter the required information.
It takes three pieces of data to describe and anchor, five for the attribute, and four for the link, so adding a new entry should take less than five minutes.
What’s next
That was a short introduction into documenting your database using the Minimal Modeling approach.
In the following posts we’ll continue exploring WordPress database schema. The end goal is to have a complete description, covering every single table and column.
Also, we’ll discuss the Minimal Modeling approach in more detail, as related to understanding your existing database. Particularly, we’ll see how to handle multi-database cases, both for primary data and for secondary (analytical) data, like data warehouses.