Dependent and independent pieces of data
Ordinarily data attributes and data links are independent. For example, if you store the age of the user and the name of the user, both pieces of data do not depend on each other: all combinations of name and age are possible.
We’ve been discussing either/or data for some time now. Our model example is the health declaration: passengers declare if they have any symptoms of COVID-19, and if yes then which of them. It is one of the examples of non-independent, or non-orthogonal, or entangled pieces of data.
In this series of posts we investigate how to model this kind of data on the logical layer (we use branched representation). Later we’re going to discuss how to model this data on the physical layer: basically, in which tables do we put both pieces of data (“do you have any symptoms?” and “which symptoms do you have?”), and how can we make sure that the data is consistent.
But how do we prove to ourselves and to others that certain pieces of data are non-independent? Normally we prefer simplicity, so we’d like not to introduce more complicated data models, unless it is really needed.
Quadrant analysis
We can represent our data structure in a tabular form, using quadrants. For simplicity, we’re going to cover only two pieces of data for now. It is possible to extend this analysis on three and more.
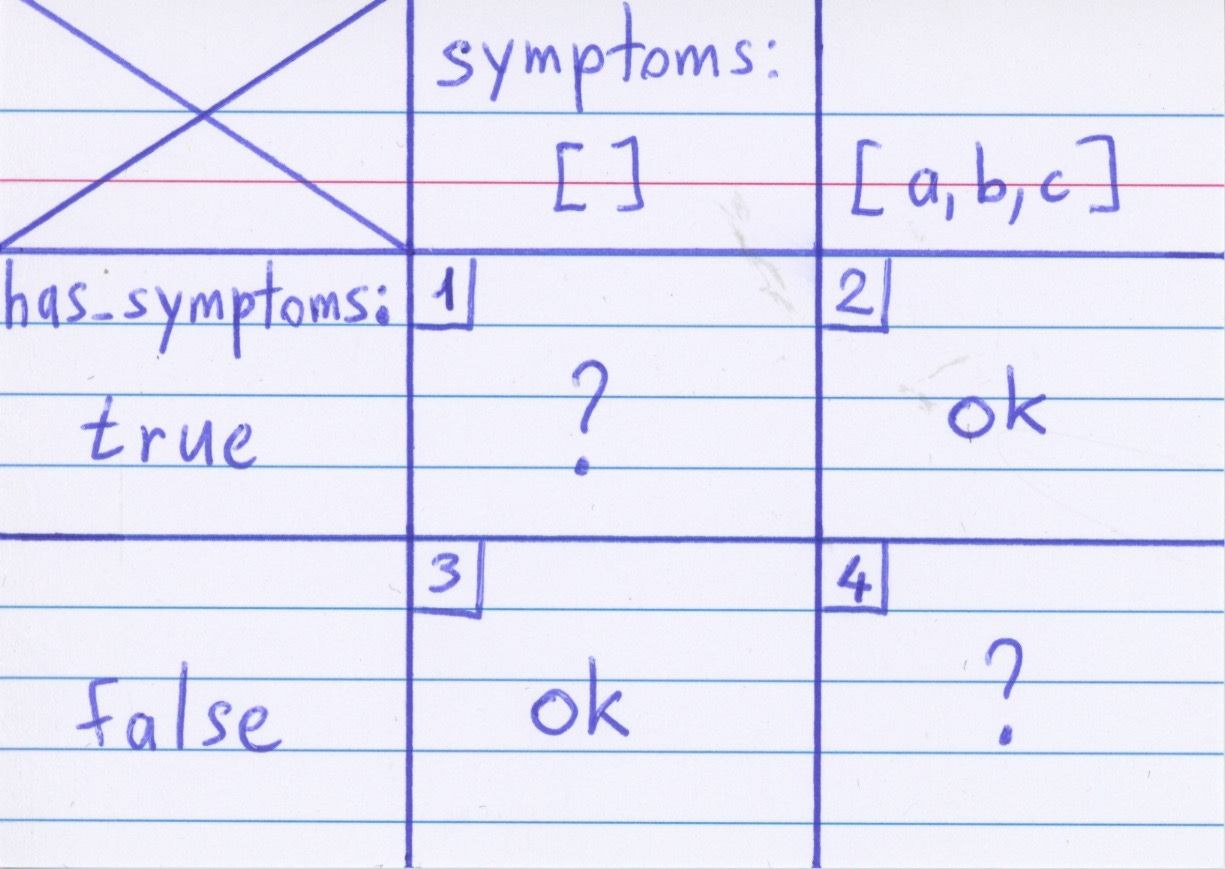
1/ we have to draw a 3x3 matrix. You may use whiteboard, paper, or a spreadsheet. Top-left cell is not used.
2/ for each piece of data, we’re going to find two possible kinds of values that could help demonstrate inconsistencies. This requires a bit of intuition: we do not yet have a comprehensive list of examples for each type of data, but hopefully the provided examples will illustrate the idea behind this.
for boolean attributes (such as “does passenger have any symptoms?”) it’s going to be just “true” or “false”.
for 1:N relations (such as “which symptoms does passenger have?”) we have “zero items” and “one or more list items”. We’d use a common array notation: [] and [a, b, c]. We do not care about the contents of a list, just that it’s empty or non-empty.
3/ we fill the left column and the top row with the kinds of values that we’ve found. Also, let’s number the remaining cells to make it easier to discuss them.
4/ now we look at the four remaining cells. We write “ok” if the combination of values makes sense, or a question mark otherwise.
Let’s elaborate our thought process for each cell:
“I do have symptoms” + empty list of symptoms: what could that possibly mean? Write down a question mark.
“I do have symptoms” + a list of symptoms: ok, makes sense!
“I do not have symptoms” + empty list of symptoms: ok, makes sense!
“I do not have symptoms” + a list of symptoms: what could that possibly mean? Write down a question mark.
What did we learn from this?
We proved to ourselves that in our example data really is non-independent (because there are combinations of values that would make the data inconsistent).
We also have two “what could that possibly mean?” questions. We may actually find an answer to those questions! This example is very straightforward, but in other situations it’s possible that there is a valid interpretation for the combination of values. Just run those questions by the problem domain expert.
We now have a common vocabulary that we can use in discussing this data with everyone.
We can look for the “forbidden” combinations of values in the actual database, and if we find any, we know that we have a bit of a problem with the data and we can begin looking for solutions.
We know how to generate correct and incorrect cases to test how the code handles those kinds of situations. Also, we can test both the data-fixing and the data validation code.
If all the cells would contain “ok” then we would learn that the data is actually independent.
Sometimes you will have question marks not because the data is non-orthogonal, but because a piece of data is derived from another piece of data. For example, if we store a number of posts submitted by a user as an attribute, and there is a table where posts are stored, those two counts may be out of sync due to a bug or propagation delay. We’re going to discuss derived data extensively in later posts.
Inventing interpretations
Software developers love inventing clever tricks. Somebody would have a bright idea on how we could maybe interpret one of those “forbidden” cases that we’ve discovered during the analysis.
What if “I do have symptoms” + empty list of symptoms could mean…
This is dangerous, do not go that way (at least now). We are thinking on the logical level currently. If you need more information then instead of encoding them as a special combination of values, just introduce more attributes, or more relations. Design those attributes properly, and only then you should be looking for the way to physically encode them in tables and fields of your database.
Just a reminder: if you look closely, null references, also known as “The billion dollar mistake”, are the result of this way of thinking. People tried to find interpretation for a nonsensical case (null pointer, basically), decided that it could mean “object was not found”, and here we are:
Segmentation fault (core dumped)In the next installment we’ll talk about data types in database modeling, unless we again have a better idea. This would be the last step before we would directly tackle the relational modeling of either/or data.


